Brad Mormann
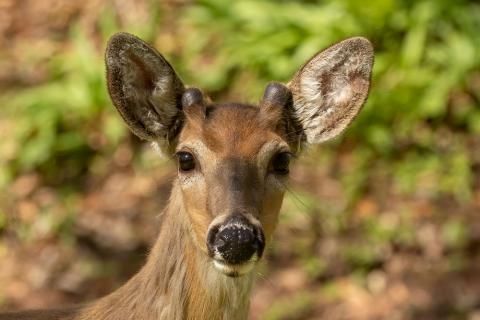
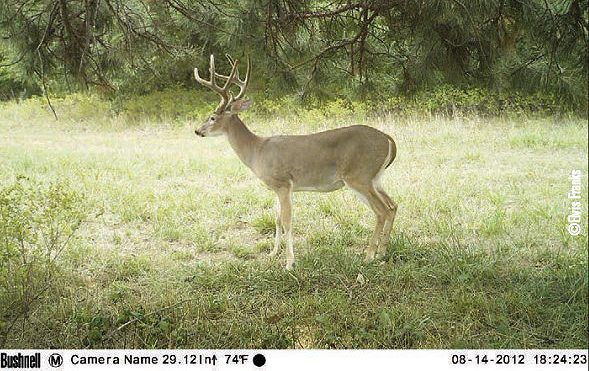
I sat on my couch this fall with a snoring dog lying next to me, as I diligently scrolled through thousands of digital pictures. These weren’t digital pictures of my family’s vacation or of a past fishing trip; they were pictures of deer eating corn. The corn, deliberately placed to capture images of all deer that took a bite, was part of my trail camera survey plan. There are few things I like better than looking through deer pictures.
Some deer stroll into the frame without a care in the world heading straight for the corn, others seemingly tip-toe in ready to bolt at an instant. I can only imagine what’s going through their mind as they creep in: is there a coyote ready to pounce from the bushes or a dominant buck following behind that is itching to protect the food source and send them packing? With each picture I tally the number of does, fawns and bucks, in addition to copying unique bucks into a separate folder for future identification. All of which requires a lot of time and effort which causes my mind to wonder what else on my “honey do list” I should be completing instead and is this all worthwhile?
When determining whether to do a trail camera survey on your own hunting property it is important to consider the costs and benefits. Let’s begin with the costs:
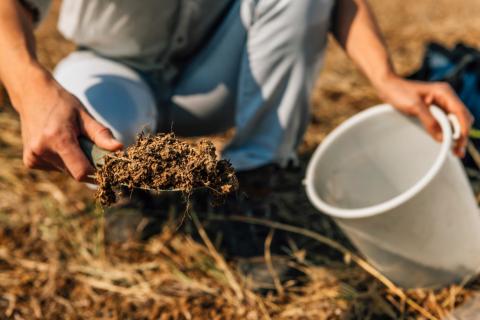
Pre-Baiting Your Site
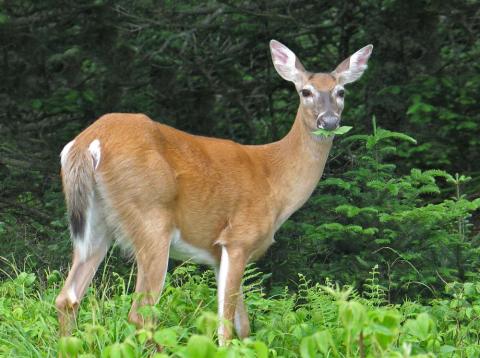
Trail camera surveys can be done with a variety of baits including salt, corn and other feeds and attractants. Corn is far and away my favorite bait to use. It is a universal attractant that bucks, does and fawns can’t seem to resist. Couple its attractiveness with the late summer and early winter food stress periods and over 90% of the deer herd will be posing for your camera. However, corn can be costly depending on how, when, where you buy it. Ten years ago it cost half as much as it does now and last year it was two dollars more per bushel than now. Traditionally there is fluctuation in the price of corn so if you are planning to do a survey start looking at prices now to determine when to stock up.
The actual amount you will use per trail camera site will highly depend on the size of your deer herd, where you set up the feeding site and how you feed it. A good starting point is about 20 pounds per site. As you work through the “prebaiting” portion of the survey it will become clear as to how much you’ll actually need. Either decrease or increase the amount fed to maximize your herd’s time in front of the camera and minimize costs.
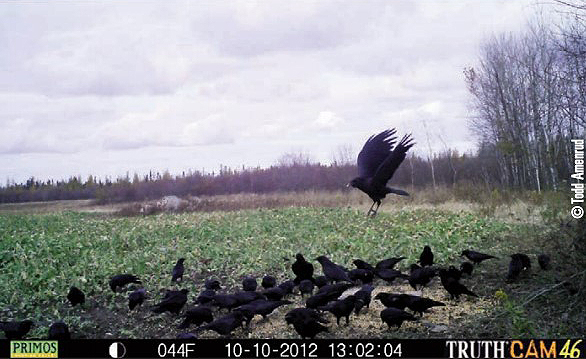
Non-Target Robbers
Non-target critters can take a toll on the corn you placed out for deer. Raccoons are a major marauder on corn, but turkeys, squirrels and crows definitely take their share. Raccoons can be somewhat mitigated by actively trapping. When crows are an issue I sometimes place my camera site under a dense tree canopy to at least give a little more time to get my survey running before the whole flock catches on. Seeing 40 crows at your camera site can be very frustrating and costly.
Number of Trail Cameras
Trail camera surveys require at least one camera for every 100 acres. On large properties this can add up with trail cameras costing $100-$500. For me; however, trail cameras are so much fun I don’t consider it a cost, I consider it an investment. Whether they are used for a camera survey or a hunting tool, patterning bucks or just seeing what’s entering my food plot, trail cameras can give a hunter a lot of confidence and enjoyment.
Time Requirements
Camera surveys require 7-10 days of pre-baiting for each camera site. Once you have the animals conditioned, then you have 10-14 days of baiting, switching camera cards, and checking batteries. Although, you don’t want to check the camera site more often than every 4 or 5 days in order to keep your disturbance down. That will still add up to several visits per camera site. Once the pictures are in hand the next step is to go through all the images tallying the number of bucks, does and fawns, in addition to identifying each individual buck. This can take several days depending on the number of pictures taken.
The Benefits of a Trail Camera Survey
Extending the Hunting Season
As I grow older I am continually thinking about what I could be doing during the offseason to improve my hunting opportunities, while also learning about my property and deer herd. Since trail camera surveys can be performed outside the hunting season when the deer are nutritionally stressed and when baiting doesn’t conflict with hunting season regulations, I can focus my attention on data collection instead of deer harvest.
Gathering Information
Remember the old saying “If you keep doing the same thing then don’t expect different results.” Gathering data can change your results in a good way. Collecting information is what we all do in our day-to-day lives in order to make informed decisions.
For instance, this fall I was preparing to sell a swing-set, but wasn’t aware of the going price for a set of this kind. Since I had planned on listing it on Craigslist, I did a search on “swing sets” to see the price range others were selling them for. From that search and the data I collected I was able to competitively price my swing set comparable to others in my area. This saved me time and potentially money because my initial idea of a fair swing set selling price was substantially different than what the market was dictating.
The collection of data and your conclusion of them work much the same way with your deer herd. In the case of my swing set I needed to know a good selling price to improve my chances of selling it quickly and at a fair price. For deer, we are trying to determine and monitor the herd dynamics that can affect herd health. These dynamics are: adult sex ratio, buck age structure, population and fawn recruitment. Although each individual season/year of data is valuable, it’s the trends from year-to-year that provide the best information.
1.) Adult Sex Ratio: The adult sex ratio or doe-to-buck ratio is an important indicator of herd health. As the number of does outnumber the quantity of bucks the chances increase that not all does will be bred the first time they are receptive during the rut. A doe’s biology then causes her to be unreceptive for about one month and then briefly receptive again, repeating for several months. Each time this occurs the fawn will be born later and later into the summer. The later a fawn is born during the summer the less nutritious vegetation will be available for the doe’s milk and subsequently the fawn’s growth. As you can imagine, starting life on wobbly footing can hinder future growth and increase mortality.
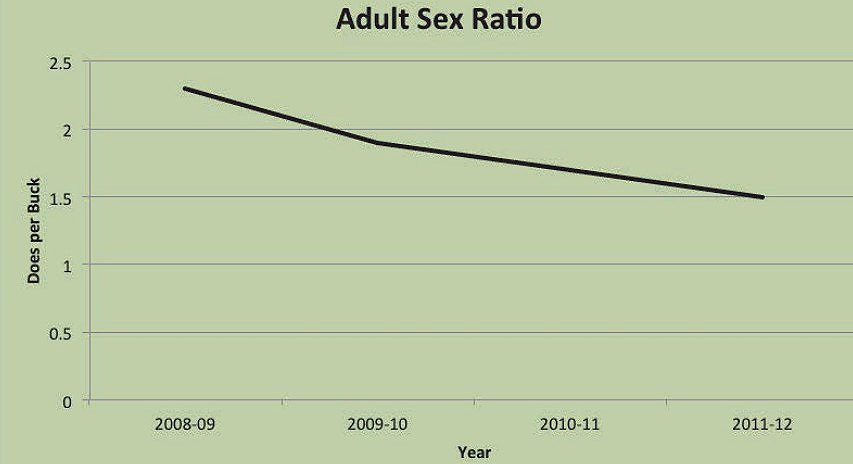
The graph, “Adult Sex Ratio” demonstrates how annual trail camera surveys show the trend in a deer herd’s adult sex ratio. In this case, an increased doe harvest over several years has lowered the doe-to-buck ratio allowing it to become more balanced. With this data in hand, it aids a hunter or manager in planning the next year’s doe harvest strategy. As this data suggests it may be time for scaling back the doe harvest into a “maintenance phase” to maintain the more balanced sex ratio.
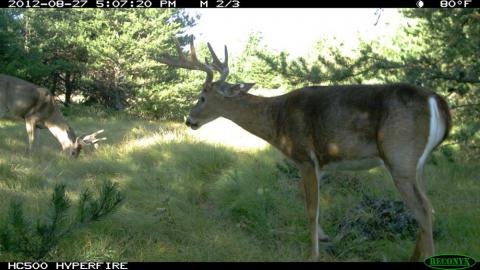
2.) Buck Age Structure: Buck age structure is basically the spread of bucks throughout the age classes. A healthy herd has bucks reaching the older age classes of four years old and older. For the hunter there are at least two big benefits in having bucks in the older age classes. One is older bucks tend to create more sign than younger bucks in the form of rubs and scrapes.
The second is that older bucks tend to have larger antlers! Four year old bucks are sporting over 90% of their antler potential while five year olds are sporting 98+% of their antler potential. So if all things are equal, just allowing a buck to reach an older age class means he will almost certainly have bigger antlers.

The graph “Percentage of Bucks per Age Class” demonstrates how a camera survey (especially late fall/early winter surveys) can show how buck age structure can change as harvest goals change. In this case a harvest age criteria was developed to allow younger bucks to live and for more bucks to reach older age classes. Showing this type of data to inquiring neighbors or hunting group members who are unsure of QDM principles is often an important step in improving support and continuation of a specific harvest strategy.
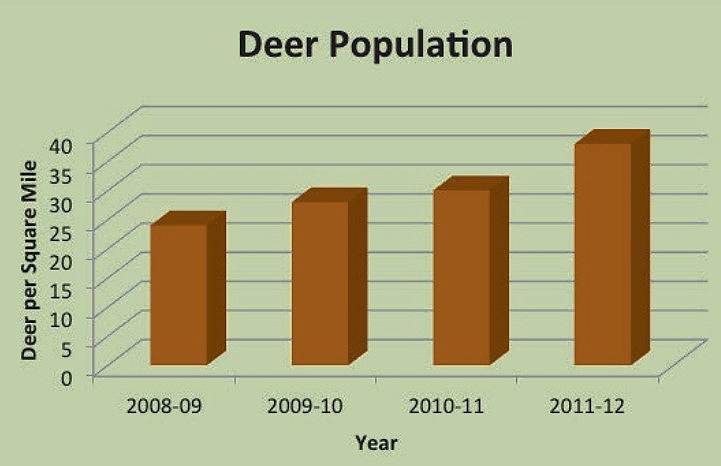
3.) Deer Population: The right deer population for any property is variable depending on the forage and cover resources available. Areas with high quality soils (i.e. agricultural areas) have the potential to hold a larger deer population at healthy levels whereas areas with lower quality soils (i.e. rocky, forested ridge tops) will hold fewer.
When looking at your trail camera survey population trend, it can be beneficial to compare it to other aspects of herd health such as changes in average weights or antler scores per age class to determine if the population is truly at a healthy level. For instance, if the population has been dropping and the weights and antler scores are increasing you are probably increasing your herd’s health.
The following graph “Deer Population” demonstrates a population trend. There is little doubt that this population is growing. This may be due to an increase in forage resources, decrease in does harvested, or both. Having this data with a strong trend can bolster confidence, especially if your goal was to increase the size of the deer herd.
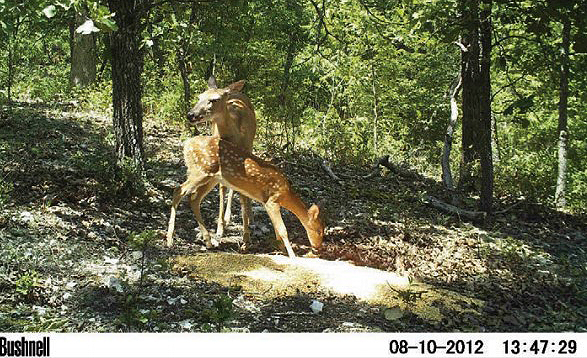
4.) Fawn Recruitment: A camera survey’s ability to accurately determine fawn recruitment (number of fawns reaching 6 months old) is highly dependent on the time of year the camera survey is performed and the detail put into analyzing the results.
During late summer camera surveys, some late born fawns will be very little and still spending a great deal of time hidden from predators in cover. This causes them to spend less time at the camera site than their mothers and other deer in the herd, causing an underestimate of their population.
Although the fawn recruitment numbers could be underestimated, if the camera survey is performed during the same time period each year it will still be possible to see trends. Since the trends are more important than an individual year’s data, nothing truly is lost.
During late fall/early winter camera surveys, fawns will be up and utilizing the trail camera sites, but extra scrutiny must be given to pictures to ensure fawns are accurately identified from yearling does. Learning physical features such as a fawn’s nose length in January will make this job easier.

The “Fawn Recruitment,” graph demonstrates a fawn recruitment trend. The data is indicating that more fawns are being recruited into the population each year. This may be a result of improved management that led to a more balanced doe-to-buck ratio, an increase in forage and cover resources, and/or a decrease in the population. In any case, having data to strongly suggest an improving fawn recruitment rate is an encouraging endorsement of a management strategy.
Bottom Line
As you can see, there are several costs and benefits to performing a camera survey. Every time I consider performing a trail camera survey I must look at my budget and then at the herd health goals I have for my property.
Although for many hunters, thinking about herd health may seem unimportant to achieving hunting goals, but they are very closely related. Seeing the results of a healthy deer herd can be as simple as adding one more year of data to your graphs. These numbers aren’t randomly pulled from the air, guessed at, or based on a neighbor’s casual observations, these are scientific data. Learning more about your deer herd and what qualities of the herd could use improvement, gives you the opportunity to make a difference in the outcome of your next deer season.
Brad Mormann is a wildlife biologist, consultant, and outdoor writer.