Get the Most Bang for your Buck!
MSU Deer Lab (Bronson Strickland, Steve Demarais, Eric Michel & Marus Lashley) | Originally published in GameKeepers: Farming for Wildlife Magazine. To subscribe, click here.
Planting late summer/fall food plots has become an annual tradition for most deer hunters. Along with the work days at deer camp that used to entail bushhogging, hanging stands, and cleaning up the camp now includes preparing and planting fields to produce deer forage for the hunting season.
Over the years, most every hunter, or hunting club, has decided upon a particular forage, or blend of forages, that they like. Many hunters decide what they like based on what grows well, what looks green and luscious, and where they see deer feeding the most, but is there a more scientific way to determine which forages deer prefer most? Is there a way to determine which forages truly produce more food biomass for deer? The answer is absolutely.
There are two general ways to approach measuring food plot performance. The first is on the short-term and the second, and most important, is over the long-term. We will review both.
Gauging Short Term Performance Measure the Forage
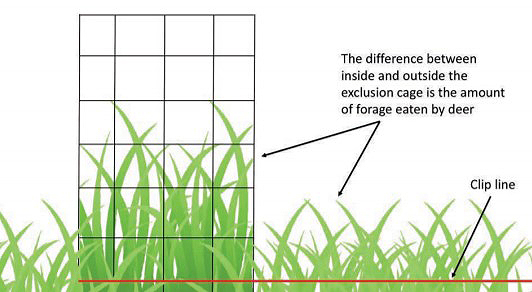
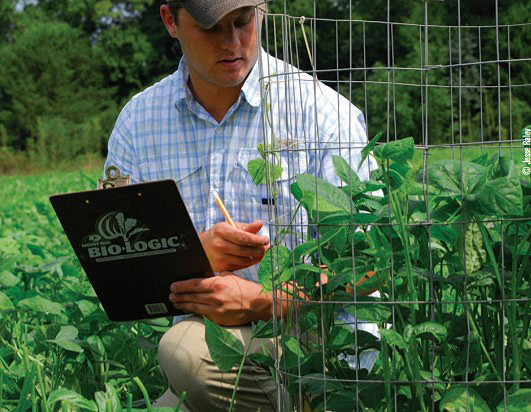
The single best way to measure food plot performance in the short-term is with the use of an exclusion cage. An exclusion cage is simply a barrier that will restrict a deer’s access to a small area of the food plot. Most of our exclusion cages measure 2-3 feet in diameter. You can use a few t-posts or rebar to hold up dog kennel fence, chicken wire, hog wire, etc. The type of fence does not matter as long as deer cannot eat the forage inside the cage and the fence strands are wide enough to let ample sunlight through the cage.
Often hunters think that a food plot has failed (bad seed, not enough fertilizer, drought, etc.) when the real reason for the lack of forage in a plot is because the deer have eaten it to the dirt! That is a pretty important distinction to make that can be easily accomplished with an exclusion cage. Seriously, an exclusion cage is just as important as the seed, lime and fertilizer! Without an exclusion cage, there’s no way for you to measure the production of the forage or how much the deer like it!
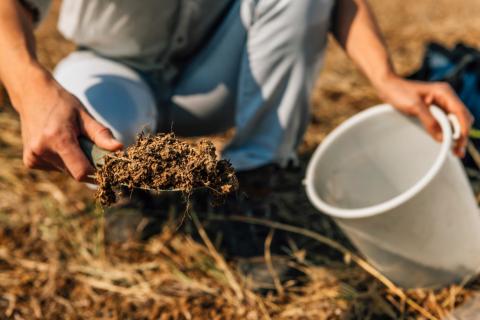
So how do deer biologists measure forage production? Typically, forage growth is measured on a monthly scale, but you can measure every two weeks if you want to take the time to do so. Production is simply the weight of the forage inside the exclusion cage. We move the cage and clip all the foliage down to about two to three inches above the ground. Then, we put all the foliage in a bag and on a scale. The weight of the bag is the amount of forage biomass produced in the cage.
To determine how much forage is being produced on a per-acre basis, you have to make a few simple calculations. First, you must determine the area (ft2) of the cage. If your cage is shaped like a square, then the calculation is simply length x length. For example, if all four sides of the cage are 2 feet, then the area is 2’ x 2’ = 4 ft2. If the cage is circular shaped, then use the following formula area = pi x r2, where pi = 3.14 and r = radius (which is half of the diameter). So, let’s say the diameter of your circular cage is 3 feet, simply divide the diameter by 2, square the radius, and multiply by 3.14. For example, 3 ÷ 2 = 1.5, now multiply 1.5 x 1.5 = 2.25, and finally, multiply 2.25 x 3.14 = 7 ft2.
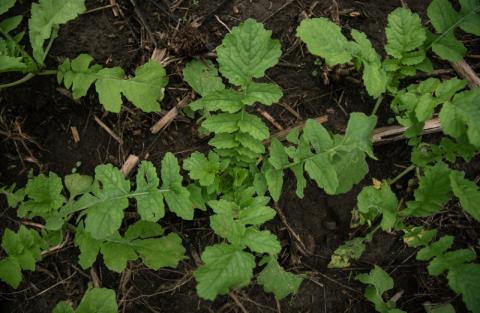
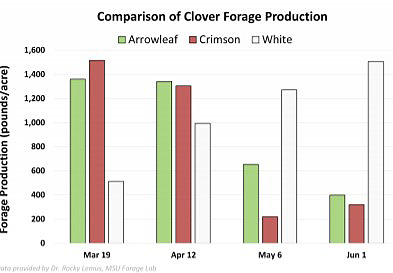
Now that you know the area of your exclusion cage, you need to scale your measurements on a per-acre basis. There are 43,560 ft2 in an acre, so we simply divide the area of an acre by the area of our cage (43,560 ÷ 7 = 6,223). Now multiply the weight of your forage sample from inside the exclusion cage by 6,223. So if we collected 0.5 pounds of forage from inside the cage, our per-acre amount would be 6,223 x 0.5 = 3,112 pounds of forage per acre. Keep in mind this is the wet weight, which includes the weight of the water. Researchers go one step further and dry the forage in a special oven to remove the water weight, but that’s not necessary for you to do as long as you weigh the forages fairly soon after cutting them. “Figure 1” shows some clover forage data collected by the Mississippi State University Forage Lab and demonstrates what you can learn from the growth habits of different forages from place to place and year to year.
Now you have an accurate estimate of the amount of forage produced over the time period you measured (2 weeks, 1 month, etc.), but this is only half of the equation. Your next step is determining deer utilization. After all, forage that produces the most biomass is useless if deer don’t eat it!
Utilization is measured as the difference between the amounts of forage inside versus outside the exclusion cage. For example, let’s say you clipped the amount inside the cage and calculated the weight as 0.5 pounds. Now you have to clip the amount on the outside by clipping down to the same height near the ground as you did inside the cage. If you clipped all the forage down to 3 inches inside the 7ft cage area, you should clip down to the same 3-inch height outside the cage in a 7ft area.
Let’s say the weight of the forage outside the cage was 0.2 pounds – therefore, the amount of forage utilization on a per acre basis is 3,112 – 1,245 = 1,867. So, our food plot is producing 3,112 pounds of forage and deer have consumed 1,867 pounds, on a per-acre basis. Calculating both the amount of forage produced and the amount consumed will help you determine which forages are the best for your property. See “Figure 2” for a diagram showing how to collect forage for these measurements.
Now, we know what you’re thinking – I don’t have time to measure forage production every month on all my plots or I don’t want to disturb my plots by traipsing around in them all the time. And those may be perfectly legitimate reasons not to go out and collect the forages. However, that does not diminish the value of the exclusion cage. There is still value to seeing how tall the forage is inside the cage versus outside. Not only is it pleasing to see the difference inside the cage from the stand while anticipating seeing the mouths that did it, but it also allows you to see when you had a crop failure or when you have a weed problem. It is hard to know whether a food plot is a dirt patch because of deer or poor germination if you don’t use a cage.
Evaluating Long-Term Performance
You have learned how to measure the productivity and utilization of deer food plots, but how do you know if the plots are doing any good? We think there are two possible answers, depending on your objectives. First, some people plant food plots simply to facilitate deer observations and harvests. There is nothing wrong with that, but keep in mind, this type of food plot is typically not providing the amounts of forage that will produce bigger bodies and antlers. In this case, you improved the deer’s diet quality, but not enough to cause measurable changes in deer quality. Examples include providing only fall food plots with food available during the fall and winter, and/or providing a very limited acreage of food plots. You have provided enough food to modify deer behavior, but not enough to “see” a change in the deer herd.
performance a look at your animals is
necessary. Keep records so you can chart
how body weights, lactation rates and antler
measurements compare year to year.
Enough Forage?
You may hear that only one to three percent of a property should be in food plots to see differences in deer quality. Well, this all depends on habitat quality and the availability of natural foods relative to the deer density. Research conducted in Mississippi and Tennessee has shown that in southern pine and hardwood forests the amount of natural food available to deer varies dramatically based on timber management techniques. For example, a dense stand of timber that allows very little sunlight to reach the forest floor will produce about 100-400 pounds of quality deer forage in a year. Conversely, a thinned forest stand can produce 1,000 pounds of good deer forage in a year. So there’s a finite amount of quality deer forage available to the deer population each year, and the amount of quality forage available to each deer simply depends on the number of deer in the population. This is why deer biologists and managers are so insistent on keeping deer herd numbers in check with the habitat’s carrying capacity the easiest way to improve the amount of quality forage available to each deer is to lower the number of deer!
Measuring Animal Performance
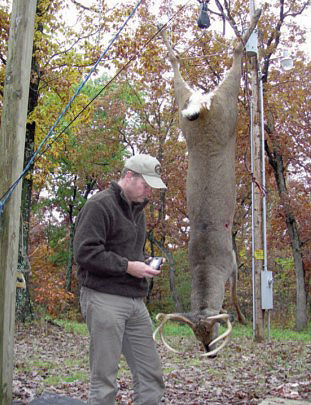
Over the long-term, the best way to determine if your management efforts have been effective is to measure the target of your management – the deer! Deer biologists always stress the importance of data collection so you can actually measure progress over time. Antler size, body weight and lactation rates, relative to age, are all metrics that biologists use to monitor the health of a deer herd.
Calculating Bone
The Boone & Crockett scoring system is the “gold standard” for measuring antler size, but some of the measurements can be tricky if you are not experienced. At minimum, we recommend that you record the total number of antler points, length of the main beams, inside spread, and basal circumferences. These measurements are good enough to characterize the antler size of the buck and track age-specific progress. Furthermore, we have a tool on the MSU Deer Lab website to estimate Boone & Crockett score using the aforementioned measurements.
Lactation Assessment
Lactation rates provide an index of reproduction and is calculated as the percentage of harvested does lactating. Lactation rates above 70 percent are generally an indicator of very good reproduction, while rates below 60 percent indicate potential problems. Very low rates, less than 40 percent, are typically symptomatic of predator issues.
You can collect these valuable data by either pinching the nipple or cutting into the udder of a harvested doe to look for milk. Furthermore, even if no milk can be seen, a swollen udder indicates she lactated, which is often the case later in the hunting season when fawns have been weaned.
Measuring Body Weight
Dressed body weight is another good indicator of herd condition and a reliable measurement to evaluate food plot performance. Mother Nature has programmed deer to survive in environments with limited food, but when good foods become available, deer will take care of their body first and antlers and reproduction will respond accordingly.
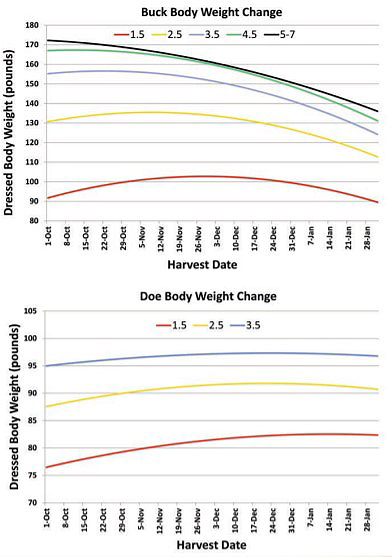
If you work with a deer biologist from your state wildlife agency they can provide average body weights for your region that can be a target for management. Not only does body weight vary greatly by age and from region to region, it can even vary throughout the hunting season. “Figure 3” shows how both buck and doe body weights change over the hunting season in Mississippi. Notice how the patterns differ between bucks and does.
With bucks, their priority shifts from food intake early in the season to chasing does later in the season. Older bucks are typically at their greatest weight at the beginning of hunting season, while yearling bucks may not reach their peak until the middle of hunting season. Does, on the other hand, an increase in body weight throughout the hunting season because they are not spending their energy chasing boyfriends and they need to be in peak physical condition to grow those developing fawns in their body. These patterns of body weight change are important to consider when you are monitoring the progress of your management plan. For bucks, we recommend that you group by age and by month of year. After all, a buck can lose up to 30 percent of his body weight from the pre-rut to the post-rut.
We hope to have provided some techniques to help you quantify your food plot performance as well as your overall management plan for both the short and long-term. By collecting these important data you can become a better gamekeeper and develop management strategies that will positively impact the herd so you can get the most “bang for the buck!”